
Using Data and Analytics to Improve Your Software Development Organization
Software development organizations generate enormous amounts of data, commits, builds, tests, incidents, tickets, deployments. But in many companies, that data is either siloed, ignored, or reduced to vanity metrics that don’t actually guide decision-making.
High-performing organizations take a different approach. They use analytics to run engineering like a business: tracking performance, aligning investment with outcomes, and continuously improving how the team delivers value.
For engineering leaders, and for investors evaluating an organization, data becomes the bridge between technology operations and business performance.
1. Measure What Actually Matters
Too often, engineering teams default to the wrong metrics: lines of code written, hours logged, or tickets closed. These don’t reflect velocity, quality, or business impact. The most useful measures focus on flow, stability, and outcomes:
Lead Time to Production: How quickly code moves from commit to production. Shorter times mean faster iteration and customer responsiveness.
Deployment Frequency: How often new value reaches users. Mature organizations deploy in smaller, frequent increments.
Change Failure Rate: The percentage of releases that cause incidents or rollbacks. Low rates indicate disciplined engineering and testing practices.
Mean Time to Recovery (MTTR): How fast the team resolves issues in production. This measures resilience.
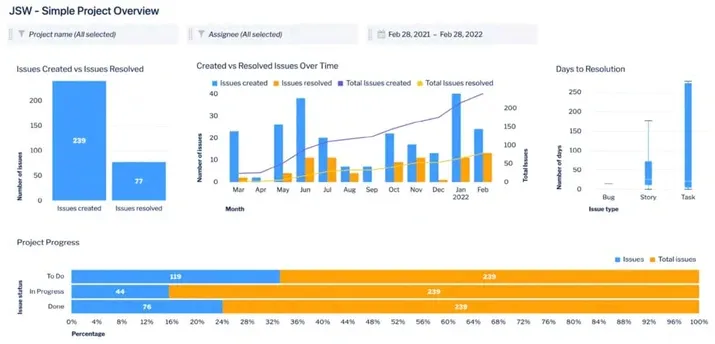
Atlassian Analytics Dashboard
These are the widely recognized DORA metrics, but the key is context. Don’t just benchmark against industry averages, track your own trends over time. Improvement is the real story.
2. Balance Innovation, Maintenance, and Technical Debt
Every engineering organization wrestles with the same trade-off: how much time to spend on new features vs. keeping the lights on vs. long-term improvements. Without data, these trade-offs are made reactively, often skewed toward feature pressure from sales or product.
By tracking engineering time allocation, you can bring discipline to the conversation:
% of capacity on innovation / new features: revenue growth, market competitiveness.
% on maintenance / bug fixes: customer satisfaction and retention.
% on technical debt paydown: long-term velocity and scalability.
Healthy organizations typically allocate 50–60% to innovation, 20–30% to maintenance, and 15–25% to technical debt. If you’re outside those ranges, you should be able to explain why and how you’ll rebalance over time.
Why this matters in diligence: Investors see these allocations as a proxy for sustainability. Too much maintenance suggests fragility; too little debt reduction signals slower velocity ahead.
It’s not just the percentages that matter. It’s the trends over time and the narrative behind them. A company that can show a deliberate shift in allocation (e.g., reducing maintenance load year over year as quality improves, or temporarily spiking debt paydown ahead of a major platform shift) demonstrates operational maturity. Investors don’t just want to see that you’re in the healthy ranges; they want evidence you can intentionally manage those levers in response to business priorities. The real red flag isn’t being out of range. It’s not being able to explain the ‘why’ or show progress toward balance.
3. Use Data to Build Smarter Roadmaps
Most roadmaps fail because they’re driven only by customer requests or sales pressure, without grounding in engineering capacity or actual product usage. A data-driven roadmap integrates engineering performance metrics with customer usage analytics to balance business value, scalability, and sustainability.
How usage data strengthens roadmap planning:
Feature Value vs. Effort: Prioritize features not just by sales input, but by actual customer adoption patterns. If analytics show 80% of customers rely on three core workflows, doubling down there may deliver more value than a long tail of underused features.
Expansion Opportunities: Usage tied to consumption-based metrics (seats, storage, transactions) should directly influence roadmap prioritization. Features that unlock upsell or expansion should rise in priority.
Retention Signals: Declining engagement or churn patterns can highlight where roadmap investment is needed (e.g., improving onboarding or strengthening a weak feature that customers abandon).
Technical Debt Paydown: If usage is heavily concentrated on certain components, prioritize refactoring and resilience work there to prevent bottlenecks.
Scalability Milestones: Use usage growth curves (e.g., DAU, API calls, data volume) to forecast when scaling investments are required—then anchor those in the roadmap.
The best roadmaps aren’t wish lists, they’re evidence-based investment plans. By combining engineering delivery metrics (velocity, stability, capacity) with customer usage analytics (adoption, engagement, retention), you create a roadmap that investors see as both credible and commercially aligned.
4. Track Quality and Reliability Indicators
Velocity without stability is a recipe for churn. To build investor and customer confidence, track quality with the same rigor you track delivery speed:
Automated Test Coverage: Percentage of code covered by automated testing, along with pass/fail trends.
Defect Escape Rate: Percentage of bugs caught in production vs. pre-production.
Incident Metrics: Mean time between incidents (MTBI) and severity trends.
Customer-Reported vs. Internally Detected Issues: A high share of customer-found defects signals weak QA practices.
Data here supports a critical narrative: “We move fast and maintain reliability.”
Test automation is critical because it ensures software quality at scale, allowing teams to catch regressions instantly and release with confidence. By reducing reliance on manual testing, it accelerates delivery cycles while improving consistency and coverage across complex codebases. In high-performing organizations, strong automation becomes the backbone of reliability, velocity, and long-term engineering efficiency.
5. Apply Analytics to Team Health and Processes
Strong engineering culture is visible in the data before it’s visible in attrition rates. Metrics that highlight bottlenecks and burnout include:
Pull Request (PR) Throughput & Review Time: Long review cycles slow delivery and frustrate teams.
Work-in-Progress (WIP) Limits: Too much concurrent work is a sign of context-switching and inefficiency.
On-Call Load Distribution: Overburdening a small set of engineers with incidents increases burnout and key-person risk.
Tracking these allows leaders to rebalance workload, refine processes, and protect velocity by protecting the team.
6. Close the Loop with Actionable Insights
Collecting metrics is easy. Using them effectively is what creates value. High-performing organizations:
Use retrospectives to analyze sprint metrics and identify systemic improvements.
Incorporate incident and quality metrics into quarterly roadmap reviews.
Share capacity allocation (innovation vs. maintenance vs. debt) in leadership meetings.
Continuously refine what they measure. Dropping metrics that don’t inform action.
The goal is not to drown teams in dashboards but to create a fact base that drives smarter decisions.
Executive Takeaway
For engineering leaders, data is no longer optional. It’s the operating system of your organization. Used well, it:
Improves predictability and delivery confidence.
Guides roadmap decisions that balance innovation and sustainability.
Demonstrates operational maturity to executives and investors.
For investors, a data-driven engineering organization inspires trust. It shows that the company is not only capable of scaling, but also disciplined enough to measure, learn, and improve along the way. In short: analytics turn engineering from a black box into a strategic asset.